

3D simulator
See how sunlight becomes water.
Clean Energy. Smarter Future.
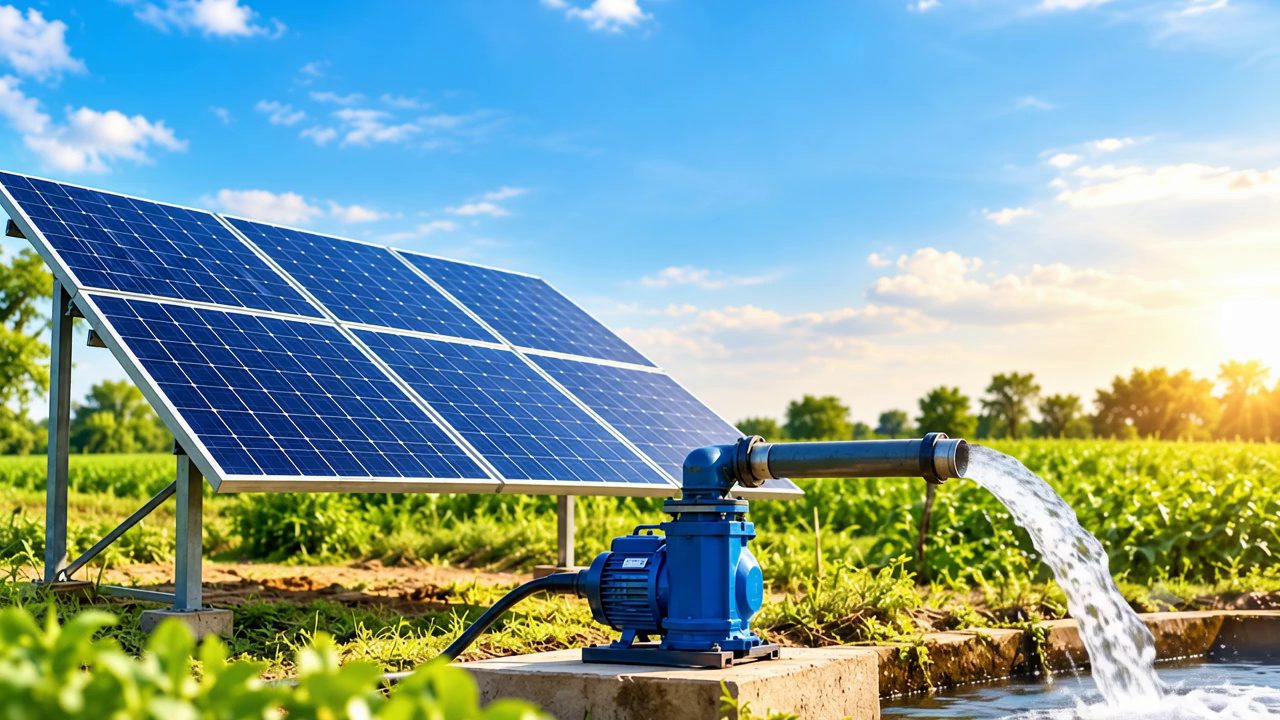
Rotate and zoom a complete solar pumping system — array, controller, pump, pipework, tank and field. Change the inputs and watch the estimated flow respond. Illustrative model, not a pump curve.
How it works — follow the energy and the water
- 1Sunlight
The sun shines on the panels. Brighter sun at midday = more energy.
— - 2Solar panels make power
Panels turn sunlight into DC electricity — no grid or diesel needed.
— - 3Controller (VFD) drives the motor
It matches the panel power to the pump and speeds it up as the sun gets stronger.
— - 4Pump lifts the water
From the well or borewell, up through the pipe, against the total head.
— - 5Tank stores the water
The elevated tank fills through the day so you can water whenever you need.
— - 6Crops get irrigated
Water runs down the channel into every crop row — the field turns greener.
—
Loading the interactive 3D model…
Through the day
- Array power available (kW)
- Pump power used (kW)
How the estimate is calculated
Sunlight through the day
G(t) = Gpk × sin^1.5(π(t − 6) ÷ 12),  06:00 ≤ t ≤ 18:00
Gpk chosen so ∫G dt = Peak sun hours (kWh/m²/day)
Power and energy
Array kWp = Panels × Panel W ÷ 1000
P_available(t) = kWp × G(t) × PV system efficiency
P_pump(t) = min(P_available, Pump kW)  if P_available ≥ start threshold, else 0
Daily energy to pump = ∫ P_pump(t) dt   (1-minute steps)
Hydraulics (physically valid)
Hydraulic energy = ρ g Q H   →   Volume (m³) = E (kWh) × η × 3.6×10⁶ ÷ (ρ g H)
                                    = E × η × 367.0 ÷ H      (ρ = 1000 kg/m³, g = 9.81 m/s²)
Flow (m³/h) = P_pump (kW) × η × 367.0 ÷ H
- Theoretical estimate. Real pumps follow manufacturer head–flow (H–Q) curves; efficiency changes with operating point, and flow falls to zero near the shut-off head.
- Clear-sky profile — clouds, dust and seasonal variation reduce output. Water-source drawdown and well yield are not modelled.
- The 3D scene is illustrative: tank height, pipe lengths and flow speed are scaled for visibility, not to engineering dimensions.
- For pump selection we use the manufacturer’s performance data and a site survey.
Planning a real pumping system?
Share your borewell depth, water level, daily water need and location.